Bar Analysis
This page provides the sections on bar analysis from the "Stress Analysis Manual," Air Force Flight Dynamics Laboratory, October 1986.
Other related chapters from the Air Force "Stress Analysis Manual" can be seen to the right.
- Bar Analysis
- Cyclic Tensile Loading of Bars
3.1 Introduction to Bar Analysis
Bars are thin structural members. This chapter gives procedures for determining the resistance to yielding of bars under static loads as well as their resistance to fatigue failure under varying loads. Tensile loading of bars is considered in detail, and information applicable to the compressive, bending, and torsional loading of bars appearing in other chapters is referenced in this chapter.
3.2 Nomenclature for Bar Analysis
| A | = | cross-sectional area, in2 |
| ft | = | tensile stress, psi |
| Fty | = | yield stress in tension, psi |
| K | = | stress concentration factor |
| Ke | = | effective stress concentration factor |
| Kt | = | theoretical stress concentration factor |
| n | = | factor of safety |
| P | = | load, lbs |
| q | = | notch sensitivity factor |
3.3 Static Tensile Loading of Bars
The basic formula for stress in a member of cross-sectional area A under a static tensile load P is
This equation, however, is somewhat limited. In order for it to be valid, the member must be centrally loaded, the section at which σ occurs must be well removed from the point of application of the load, and no stress raisers may be present near the section where σ occurs.
Bars are normally designed so that tensile loads are applied centrally. If this is not the case, they may be considered to be beams under combined tensile and bending loads and treated with the material in Chapter 1. Although the end portions of a bar are as critical as the central ones, they are not considered here since information about them more properly belongs in a treatment of connections, for example, the chapter on lug analysis in this work. According to St. Venant's principle, stress patterns become regular at a distance from the point of application of a load. In this case, the stresses become uniform at a distance from the point of application of an axially applied tensile load. Stress raisers will be considered here and when they are present, Equation (3-1) no longer applies.
If a stress raiser is present in a bar loaded in tension,
where K is a stress concentration factor. Equation (3-2) indicates that the stress at the discontinuity is K times the stress that would occur if no stress raiser were present. The stress concentration factor may be determined theoretically by the theory of elasticity, the photoelasticity method, etc., where it is designated as Kt. These values are not normally accurate, however, and are not in general used directly as will be discussed later. The following figures give values of the theoretical stress concentration factor for various cross-section and discontinuity shapes.
The theoretical stress concentration factor may be quite high as can be seen in the following pages; however, this value is usually in agreement with experiment. To account for this discrepancy, an effective stress concentration factor Ke is defined to be the one that holds in the actual situation encountered. The notch sensitivity factor, q, is used to relate the two and is defined by Equation (3-3):
The value of the notch sensitivity factor is a function of the material and the size and shape of the discontinuity.
For ductile materials that are statically loaded to near their limit, the yielding in the vicinity of the discontinuity may nearly eliminate stress concentration there, so that Ke is approximately equal to one and q is quite low.
Brittle homogeneous materials are not as capable of localized yielding, so that Ke is approximately equal to Kt and consequently q is approximately equal to one according to Equation (3-3). Cast iron of less than 45, with its flakes of graphite, however, is effectively saturated with stress raisers, so that the addition of another discontinuity seems to have little effect on its fatigue strength. Thus q is approximately equal to zero for cast iron.
The design equation for a bar under a static tensile load P that is not to be subjected to large-scale yielding is thus
For a ductile or cast iron bar, Ke may be assumed to be equal to unity and A is the reduced area at the section where the discontinuity occurs. For a bar of brittle homogeneous material, Ke may be assumed to be equal to Kt and A is either the cross-sectional area of the bar without the discontinuity or the reduced area at the cross section where the discontinuity occurs. Which of these areas is to be used is shown in a formula under each chart of Kt in Figures 3-1 through 3-12.
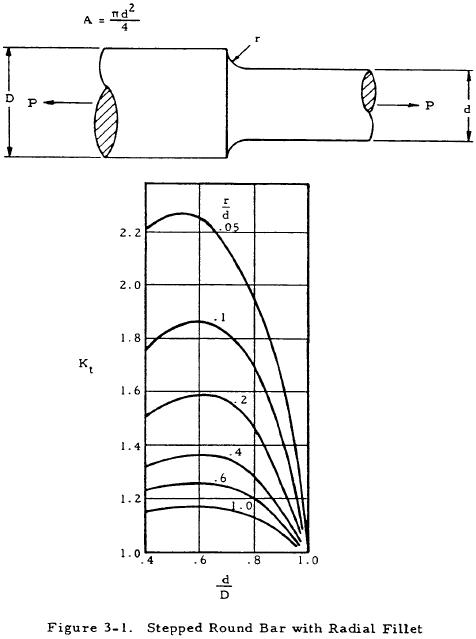

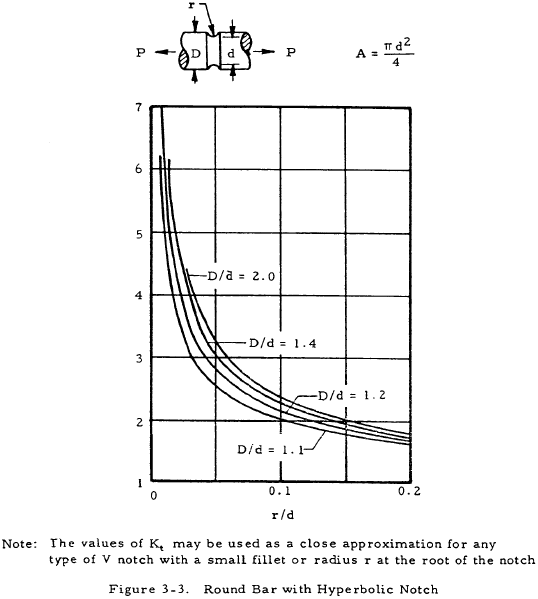
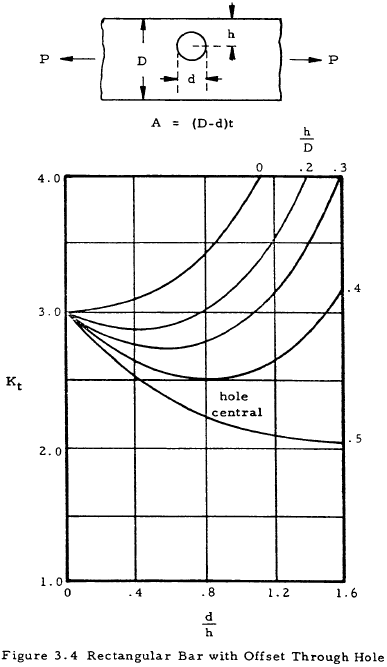
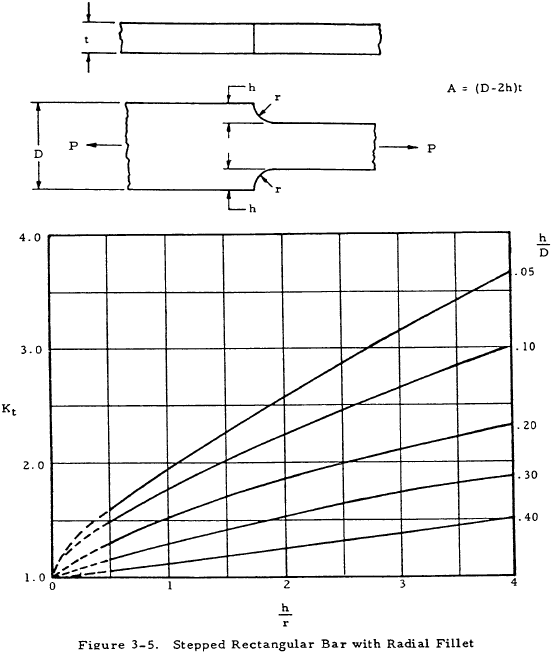
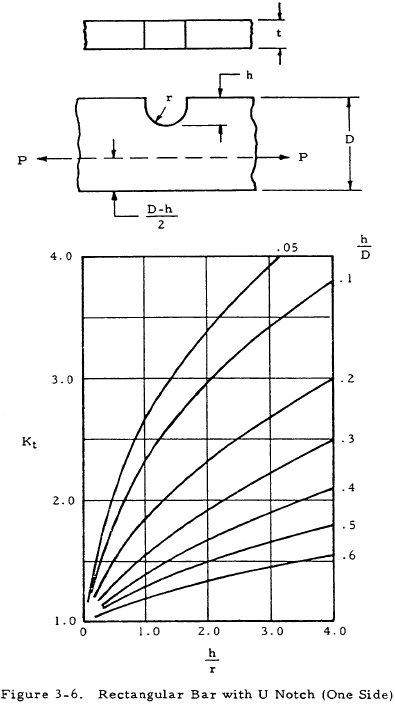
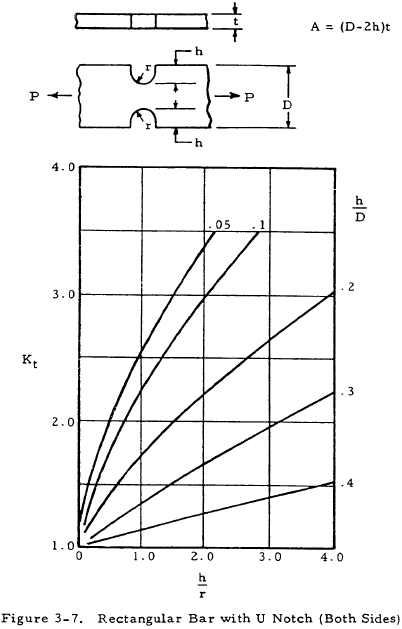
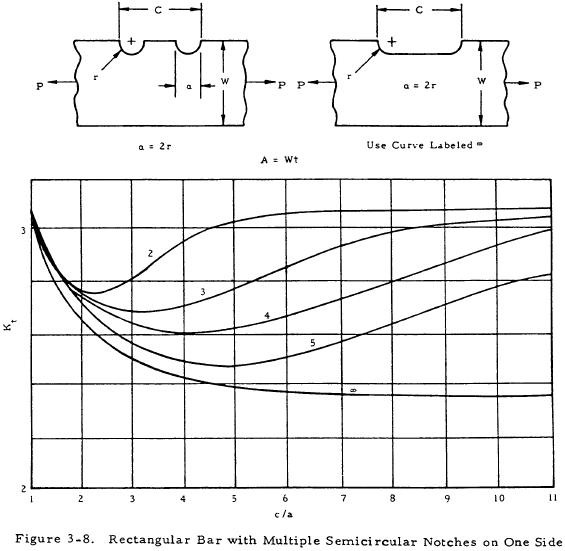
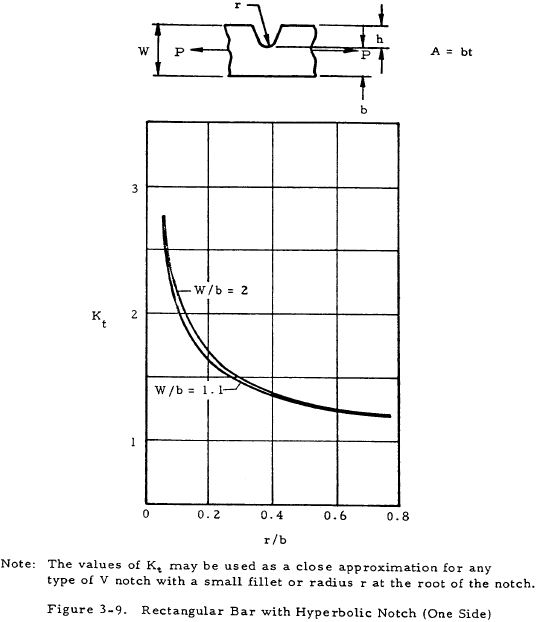
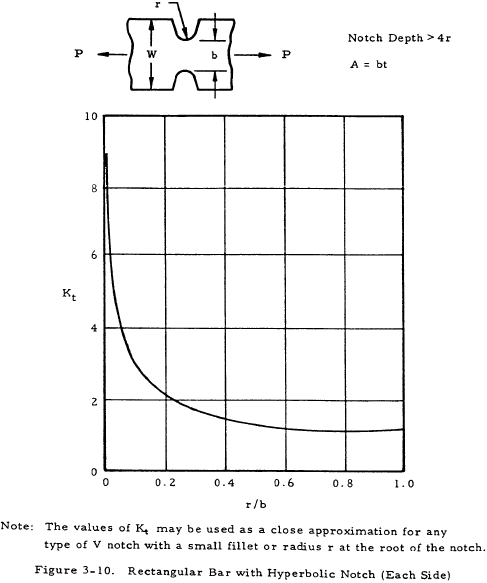
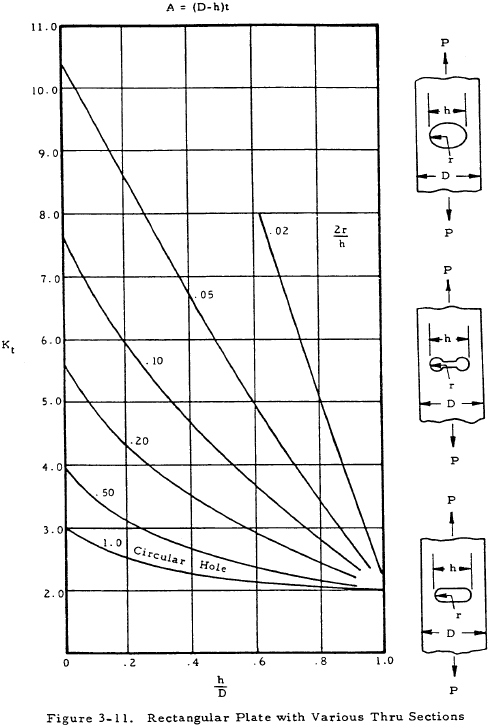
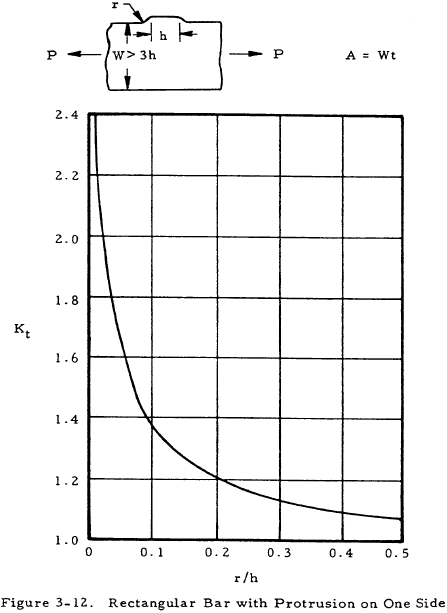
The previously described procedure yields conservative results for brittle homogeneous materials and the opposite for cast iron and ductile materials. If a low margin of safety is desired for ductile materials and cast iron, a value of q equal to 0.2 is usually sufficient to account for the effects of stress raisers.
The previously discussed material on bars in static tensile loading is summarized in Table 3-1.
| Material Type | Ke | A |
|---|---|---|
| ductile | 1.0 | reduced area of cross section at the discontinuity |
| homogeneous brittle | Kt as found in Figures 3-1 thru 3-12 | either reduced or total area of cross section as indicated by formulas in Figures 3-1 thru 3-12. |
| cast iron | 1.0 | reduced area of cross section at the discontinuity |
We have a number of structural calculators to choose from. Here are just a few:
3.4 Sample Problem - Bar Under Static Tensile Loads
Given: A circular bar is to be made of a homogeneous brittle material for which Fty = 45,000 psi. It is to support a static tensile load of 50,000 lbs with a factor of safety of 1.5. It is to have a U-notch of the section shown in Figure 3-13.
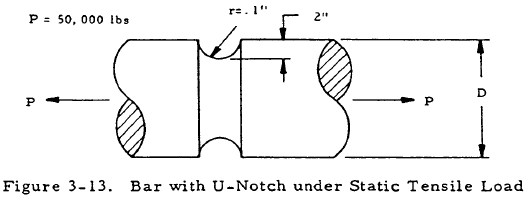
Find: The diameter
Solution: Inserting the safety factor into Equation (3-4) gives
$$ { F_{ty} \over 1.5 } = { 45000 \over 1.5 } = K_e { P \over A } = 30,000 $$From Section 3.3, Ke = Kt. Thus,
$$ 30,000 = K_t { P \over A } $$Since P = 50,000, \( 0.6 = { K_t \over A } \).
From Figure 3-2, h = 0.2, r = 0.1 thus, h/r = 2.
And furthermore,
$$ A = { \pi (D - 0.4)^2 \over 4 } $$Thus,
$$ 0.6 = { 4 ~K_t \over \pi (D - 0.4)^2 } $$Assume D = 1.05. Thus,
$$ { h \over D } = { 0.2 \over 1.05 } = 0.190 $$From Figure 3-2, Kt = 2.0. Substituting these values gives
$$ { 4 K_t \over \pi (D - 0.4)^2 } = { 4 (2.0) \over \pi (1.05 - 0.4)^2 } = 0.6 $$Thus, D is equal to 1.05 in. If the assumed value of D does not satisfy the equation, other values must be tried until a value of D satisfying this equation is found.
3.5 Cyclic Tensile Loading of Bars
The sections on cyclic tensile loading of bars have been moved to this page.
3.7 Compressive Loading of Bars
Bars that are subjected to compressive loads may be considered to be columns. The behavior of columns may be obtained by referring to Chapter 2.
3.8 Bending Loads on Bars
Bars that are subjected to bending loads may be considered to be beams and treated with the material on beams in bending appearing in Chapter 1.
3.9 Torsional Loading of Bars
Bars that sustain a torsional load may be studied by using the information on beams in torsion in Chapter 1 or that on shafts in torsion in Chapter 10.
3.10 Lacing Bars in Columns
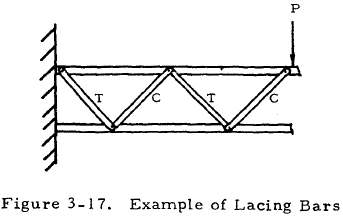
The function of lacing bars in a column composed of channels or other structural shapes connected by them is to resist transverse shear due to bending. Although these lacing bars resist shear as a group, each individual bar is loaded in either tension or compression if its ends may be considered to be pinned. For example, the type of loading on each of the lacing bars in Figure 3-17 is indicated by a "T" on that bar if it is in tension or by a "C" if it is in compression.
These lacing bars may be studied by the information given early in this chapter if they are in tension, or they may be considered as individual columns and studied by the information given in Chapter 2 if they are in compression. In addition to the strength of lacing bars as individual members, their effect on overall column behavior must be considered. This effect is treated in Chapter 2.
