Lug Fatigue Analysis
This page provides the sections on lug fatigue analysis from the "Stress Analysis Manual," Air Force Flight Dynamics Laboratory, October 1986.
Other related chapters from the Air Force "Stress Analysis Manual" can be seen to the right.
- Lug Analysis
- Lug Fatigue Analysis
- Cyclic Tensile Loading of Bars
Lug Fatigue Analysis Nomenclature
| a | = | Distance from edge of hole to edge of lug, inches |
| D | = | Hole diameter of pin diameter, inches |
| Fnu.L | = | Allowable lug net-section tensile ultimate stress |
| fa | = | Cyclic stress amplitude on net section of given lug, lbs/in2 |
| fm | = | Mean cyclic stress on net section of given lug, lbs/in2 |
| fmax | = | Maximum cyclic stress on net section of given lug, lbs/in2 |
| fmin | = | Minimum cyclic stress on net section of given lug, lbs/in2 |
| k1, k2, k3 | = | Fatigue parameters |
| N | = | Fatigue life, number of cycles |
| R | = | Stress ratio, fmin/fmax |
9.17 Lug Fatigue Analysis
A method for determining the fatigue strength of 2024-T3 and 7075-T6 aluminum alloy lugs under axial loading is presented.
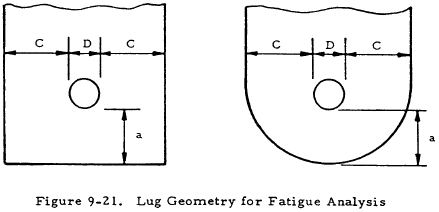
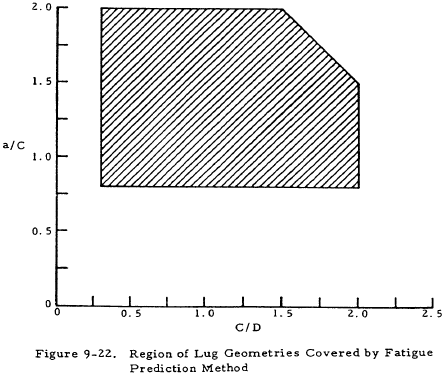
Figures 9-21 and 9-22 show the lug and the range of lug geometries covered by the fatigue strength prediction method. Fatigue lives for lugs having dimensional ratios falling outside the region shown should be corroborated by tests.
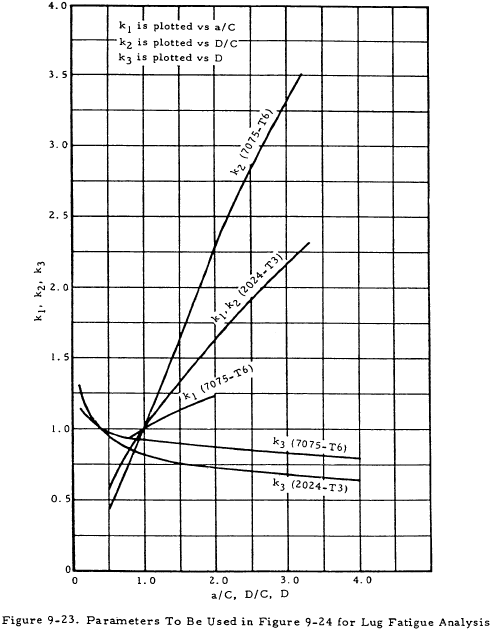
In this method the important fatigue parameters are k1, k2, and k3 (see Figure 9-23).
To find the allowable life knowing the applied stresses and lug dimensions, or to find the allowable stresses knowing the life, R value (R = fmin/fmax) and lug dimensions, use the following procedure:
- Enter Figure 9-22 to check that the lug dimensional ratios fall within the region covered by the method. Enter Figure 9-23 and read k1, k2, and k3; calculate the product k1k2k3.
- Calculate the allowable net-tension static stress for the lug, Fnu.L, according to the method described in Section 9.3.2.
- Determine the value 0.4Fnu.L. This is the alternating stress corresponding to a maximum stress value of 0.8Fnu.L when fmin = 0.8Fnu.L was chosen as an average yield stress value for 2024 and 7075 aluminum alloy lugs.
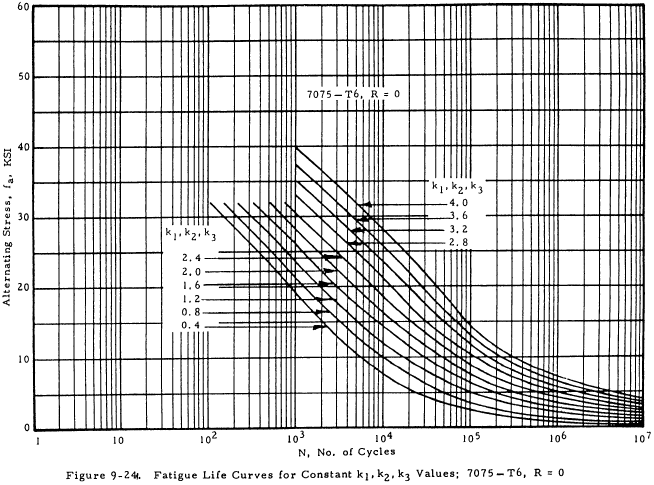
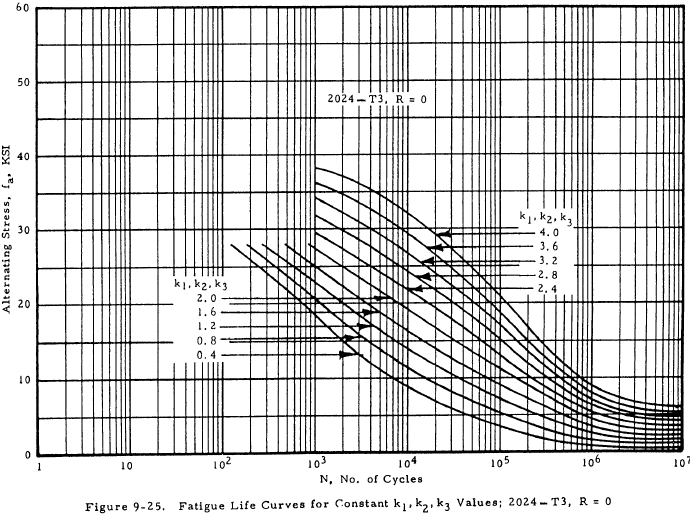
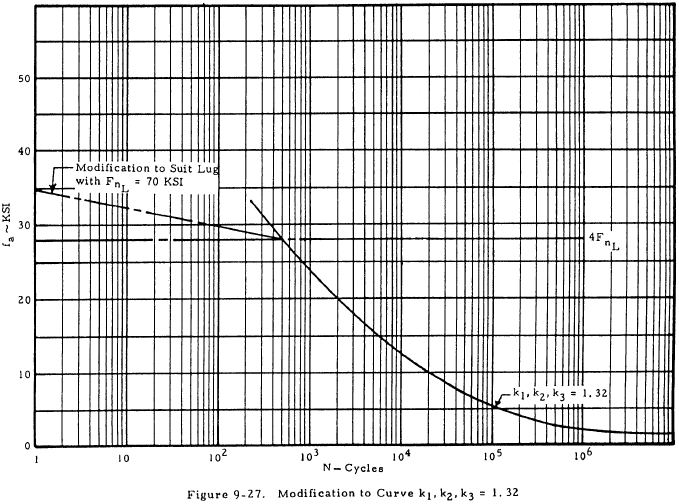
- Using the value 0.4Fnu.L as an alternating stress, draw a straight line between the intersection of this value and the appropriate k1k2k3 curve on Figures 9-24 or 9-25, and the point 0.5Fnu.L at 1 cycle. This extends the k1k2k3 curve to cover the entire life range to static failure.
- Enter Figure 9-24 or 9-25 (lug fatigue curves for the case where R = 0) with k1k2k3. For values of life, N = 103, 3×10³, 104, etc., or any other convenient values, determine the corresponding values of fa, the stress amplitude causing fatigue failure when R = 0.
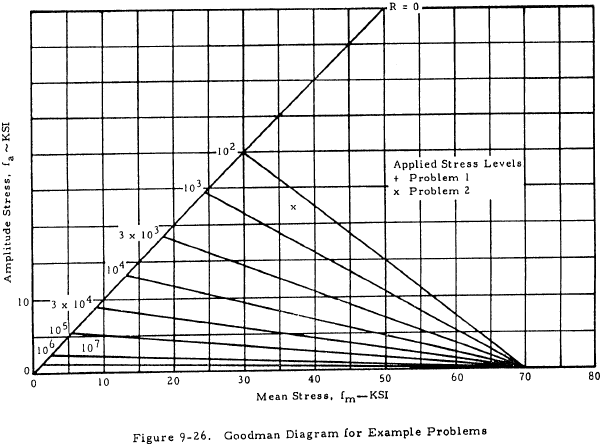
- Plot the values of fa found in Step 5 along the R = 0 line in a Goodman diagram such as shown in Figure 9-26 (fm = fa when R = 0). The Goodman diagram shown in Figure 9-27 applies to a particular 7075-T6 lug for which k1k2k3 = 1.32 (see example problem 1), but is typical of all such diagrams.
- Plot the allowable net-tension static stress found in Step 2 as fm at the point (fm, 0) of the Goodman diagram (fm = fmax when fa = 0). For the case considered in Figure 9-26, this point is plotted as (fm = 70,000 psi, fa = 0).
- Connect the point plotted in Step 7 with each of the points plotted in Step 6 by straight lines. These are the constant life lines for the particular lug being analyzed. The Goodman diagram is now complete and may be used to determine a life for any given applied stresses, or to determine allowable stresses knowing the life and R value.
Need a Lug Calculator?
Try this lug calculator based on the methodology described here.
- Allows for axial, transverse, or oblique loading
- Performs calculations for lug strength, pin strength, and double shear joint strength
9.18 Example Problem of Lug Fatigue Analysis
Given a concentric 7075-T6 aluminum lug as shown in Figure 9-21, with the following dimensions: a = 0.344 in, c = 0.3444 in, and D = 0.437 in. If the lug is subjected to a cycle axial load such that the maximum net-section stress is 27,000 psi and the minimum net section stress is 18,470 psi, find the fatigue life.
From the lug dimensions,
a/c = 1.0; c/D = 0.787; (D/c = 1.27)
(1) Figure 9-22 indicates that the lug may be analyzed using this method. From Figure 9-23,
k1 = 1.0; k2 = 1.33; k3 = 0.99; k1k2k3 = 1.32
(2) Calculate the allowable net-section tensile ultimate stress, Fnu.L, for Equation (9-4) in Section 9.3.2. For the given lug, Fnu.L = 70,000 psi.
(3) 0.4Fnu.L = 0.4 × 70,000 = 28,000 psi.
(4) Draw a light pencil line on Figure 9-24 from the point (fa = 28,000 psi on k1k2k3 = 1.32) to the point (fa = 35,000, N = 1 cycle) (This is illustrated, for clarity, on Figure 9-27).
(5) Enter Figure 9-24 and read values of fa for various numbers of life cycles, using the line k1k2k3 = 1.32. These numbers are as follows:
| N | 102 | 103 | 3×10³ | 104 | 3×10⁴ | 105 | 106 | 107 |
| fa | 30 KSI | 24.5 | 18.8 | 13.5 | 8.88 | 5.70 | 2.34 | 1.30 |
(6) Plot the values of fa along the R = 0 line of the Goodman diagram. (Refer to Figure 9-26.)
(7) Plot Fnu.L = 70,000 psi, as fm at the point (fm, 0) of the Goodman diagram. (Refer to Figure 9-26.)
(8) Connect the points plotted in Step 6 with the point plotted in Step 7 by straight lines. The Goodman diagram is now complete.
(9) Enter the Goodman diagram with values of \( f_a = {27,700 - 18,470 \over 2} = 4,615 ~\text{psi} \) and \( f_m = {27,700 + 18,470 \over 2} = 23,085 ~\text{psi} \), and read the fatigue life, N = 8×10⁴ cycles, by interpolation (test results show N = 8.6×10⁴ cycles).
If the known quantities are life and R values, e.g., N = 104 cycles and R = 0, the allowable stresses can be obtained by using the same Goodman diagram. Enter the completed Goodman diagram at R = 0 and N = 104 cycles and read the amplitude and mean stresses (in this case fa = fm = 13,500 psi).
Only if the lug dimensions are changed, must a new Goodman diagram be drawn.
