Fracture Criteria
This page provides the chapter on fracture criteria from Wang, C. H. "Introduction to Fracture Mechanics," DSTO Aeronautical and Maritime Research Laboratory, DSTO-GD-0103, 1996.
Other related chapters from "Introduction to Fracture Mechanics" can be seen to the right.
4. Fracture Criteria
4.1 K as a Failure Criterion
From previous analysis, it is clear that when stresses at the crack tip exceed yield (which always happens for engineering materials), plasticity results. However, if the redistribution of stress has a minimal effect on the crack tip elastic stress field, then the K approach to defining the stress field is still of sufficient accuracy for engineering applications. Thus, if plasticity is minimal, then a LEFM approach is justified.
Of importance to practical applications is the critical stress and strain state at the crack tip zone, which, when attained, causes the crack to propagate in a brittle, catastrophic manner. The most dangerous situation occurs when a crack is in a high-energy but constrained field that permits only slight plastic deformation at the crack tip. Expressed another way, the amount of energy absorbed in plastic deformation is reduced to a minimum extent and much more energy is thus available for fracture, i.e. crack propagation. This critical state can be described by a critical stress intensity factor Kc,
which may imply either a low stress acting on long crack or a small crack suffering a high stress. It is important to note the different meaning of the two sides of the above equation. The left hand side represents the driving force of the crack, which depends on the applied loads and the geometry of the components. The right hand side of equation (4.1) signifies the materials' resistance to fracture, which is an environment and load rate dependent material property.
Laboratory testing indicates that the fracture toughness value depends on the thickness B of the specimen tested. The plane strain fracture toughness of the materials is a material property (denoted as K1C, where subscript I denotes mode I loading). Under plane strain condition, since the crack tip plastic zone is small in relation to the component thickness, plastic contraction in the through thickness direction is suppressed by the surrounding elastic material. Tensile stresses are set up in the thickness direction of the plastic zone so that the stress state is triaxial, giving rise to constrained plastic deformation. Table 4.1 lists some typical values of plane strain fracture toughness. As before, the suffix I refers to the tensile opening mode of crack extension, whilst II and III symbolise shear and anti-plane tear modes, respectively.
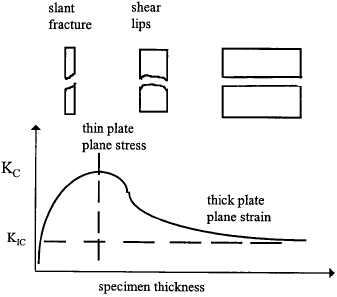
When the plastic zone is large compared with the component's thickness, the triaxiality may be relaxed and the through thickness stresses normal to the plane of the component will be negligible. In this case, the fracture toughness may vary with the specimen thickness, B. The form of variation of Kc with specimen thickness is schematically shown in Fig. 4.1. Beyond a certain thickness, a state of plane strain prevails (see Chapter 3) and the toughness reaches asymptotic value. If the thickness of the specimen is reduced, more energy will be dissipated as a result of plastic deformation near the specimen surface which is under plane stress condition. There seems to exist an optimum thickness where the toughness reaches its highest level, see Fig.4.1.
In order to achieve plane strain conditions at the elastic-plastic interface, the plastic zone must be small compared to the specimen thickness, crack length, and width of ligament
According to the ASTM standard, the following requirements must be satisfied
which is equivalent to setting the plasticity constraint factor to be √3.
| Material | Young's modulus E (GPa) | Yield stress σys (MPa) | Toughness KIC (MPa√m) | Thickness requirement 2.5(KIC/σys)2 (mm) |
|---|---|---|---|---|
| Steels | 210 | |||
medium carbon |
260 | 54 | 108 | |
pressure vessel |
470 | 208 | 489.6 | |
high strength alloy |
1460 | 98 | 11 | |
AFC 77 stainless |
1530 | 83 | 7.4 | |
| Aluminum alloys | 72 | |||
2024 T8 |
420 | 27 | 10.4 | |
7075 T6 |
540 | 30 | 7.9 | |
7178 T6 |
560 | 23 | 4.2 | |
| Titanium alloys | 108 | |||
Ti-6Al-4V |
1060 | 73 | 12.6 | |
(high yield) |
1100 | 38 | 3.1 | |
| Comparative data | ||||
Concrete |
45 | 80 | 0.2-1.4 | |
Ice |
9.1 | 85 | 0.2* | |
Epoxy |
2-3 | 30-60 | 0.5-3 | |
Boron fibre |
441 | 3000 | ||
Carbon fibre |
250-390 | 2200-2700 | ||
Boron/epoxy composite |
220-340 | 725-1730 | 46 | |
CFRP |
70-200 | 300-1400 | 32-45 | |
GFRP |
38 | 100-300 | 20-60 | |
| * not at room temperature! | ||||
Looking for Fracture Calculators?
Here are a few to choose from:
4.2 Residual Strength and Critical Crack Size
Since the severity of a cracked component is characterised by stress intensity factor, K, and failure will occur when K = Kc, the residual strength of a cracked component is,
where Y is a geometry correction factor. Note that the stress σ is the gross stress on the section on which the function a is defined, where residual strength implies a net section condition. In the case of plane strain Kc = KIC. It is conservative to assume that Kc = KIC if the detailed stress state is not known. The size of the crack at this stress is called the "critical crack size". This is normally difficult to solve in closed form as Y(a) is normally a complicated function of crack length and component geometry. Nevertheless, it can be solved numerically through iteration or, if the value of Y varies slowly with crack size, e.g. for a relatively small crack in a wide panel, an approximate value may be used. The critical crack size that a component can tolerate for a given load is
The above two equations provide the basis for fracture mechanics based design methodologies.
It should be pointed that equation (4.4) is valid only when linear fracture mechanics is applicable, that is the net section stress level is far below the material's yield stress. Otherwise the component will fail in a different mode: plastic collapse. Consider a centre cracked panel with a finite width W, the absolute highest load carrying capability is bounded by the plastic collapse strength: the stress level over the entire section exceeds the yield or ultimate tensile strength of the material. It is easy to show that the nominal stress at collapse is
When this happens, the plastic deformation becomes unbounded and fracture will occur, regardless of the fracture toughness.
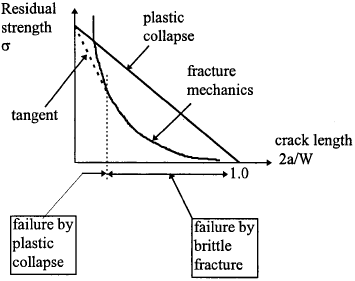
Therefore there are two possible failure modes: brittle fracture and plastic collapse. Should the fracture stress σc be higher than the stress causing failure by collapse, then collapse will prevail. As a result, the actual residual strength is the lowest of σc and σpc. Considering a centre cracked panel, there are three situations in which a plastic collapse failure would prevail: (1) the toughness is very high; (2) the crack is very small; and (3) the width W is very small. A sketch is shown in Fig.4.2. The intersection of the two curves is given by
In the short crack regime, the exact transition from one mechanism to the other is not clear, but a plausible engineering approximation is the "tangent" rule: drawing a tangent line passing through the ultimate tensile strength point. More accurate prediction can be achieved by using elasto-plastic fracture mechanics methods.
Example 4.11 Estimate the failure load under uniaxial tension for a centre-cracked panel of aluminium alloy of width W = 500 mm, and thickness B = 4 mm, for the following values of crack length 2a = 20 mm and 2a = 100 mm. Yield stress σy = 350 MPa and fracture toughness KIC = 70 MPa√m.
Solution There are two possible failure modes: plastic collapse and brittle fracture. We will assess the load level required for each mode to prevail.
(i) 2a = 20 mm.
Plastic collapse load Fpc = σys·(W - 2a)·B = 672 kN
Fracture load Fc = σc·W·B where \( \sigma_c = {K_{IC} \over \sqrt{\pi a \sec (\pi a / W)}} = \) 394.6 MPa
thus Fc = 790 kN.
The actual failure load is the smaller of the above results, 672 kN.
(ii) 2a = 100 mm.
Plastic collapse load Fpc = σys·(W - 2a)·B = 560 kN
Fracture load Fc = σc·W·B where \( \sigma_c = {K_{IC} \over \sqrt{\pi a \sec (\pi a / W)}} = \) 172.2 MPa
thus Fc = 334.57 kN.
The actual failure load is the smaller of the above results, 334.6 kN.
Looking for Fracture Calculators?
Here are a few to choose from:
4.3 R-curve
Crack extension occurs when the stress intensity factor or the strain energy release rate attains a critical value. In a truly brittle material like glass or ice, the energy for crack growth is the surface energy to form the new surface, i.e
where the factor "2" is included to represent the two crack surfaces being created. It should be noted that the energy required for a crack to grow in an engineering material is much larger than the surface energy. This is because plastic deformation will inevitably occur near the crack tip region and during crack extension energy is consumed in deforming the material plastically. In general the fracture criterion can be written as
Where γp refers the plastic work per unit area of surface created, and is typically much larger than γf.
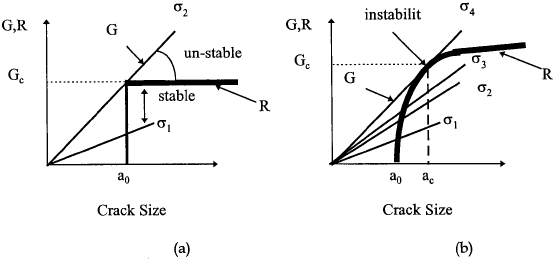
Normally it is convenient to replace 2Wf with R, the material resistance to crack extension. A plot of R versus crack extension is called a resistance curve or R curve, whereas the plot of G versus crack extension is the driving force curve. It is important to note that the driving force curve is entirely dependent on the structure geometry and loading condition, whilst the R curve is a material property dependent on temperature, environment, and loading rate etc. Most brittle materials exhibit a constant resistance sometimes called "no R-curve" effect, as shown in Fig.4.3(a). Many ductile materials, such as low strength steels, possess a rising R curve: a plastic zone at the tip of crack increases with crack length, hence the energy that would dissipate to overcome plastic deformation would increase. This is illustrated in Fig.4.3(b). The exact shape of the R curve depends on the material and, to a lesser extent, on the configuration of the cracked structure.
If a component, containing a crack or crack-like defect, and experiencing some plasticity in the vicinity of the crack, is loaded by increments the crack will extend and stop after each increase in load. This condition is defined as slow-stable crack growth. In this condition the value of the material resistance KR is equal to the applied value K at any given applied stress. Consequently the fracture toughness (Kc) may be obtained by the use of crack growth resistance curves (commonly called R-curves). These curves are a continuous record of toughness development in terms of crack growth resistance, denoted KR, plotted against crack extension under continuously increasing values of stress intensity factor, K. The R-curves characterise the resistance to fracture of materials during incremental slow-stable crack extension as a result of the growth of the plastic zone as the crack extends.
Consider a plate with a through crack of initial length 2a0. At a fixed remote stress, σ, the energy release rate varies linearly with crack size. If the material has a flat R-curve, as shown in Fig 4.3(a), one can define a critical value of energy release rate, Gc, unambiguously. The crack will grow if the applied G reaches this value. For materials with a rising R curve, such as a crack plate reinforced with a composite patch, however, one cannot uniquely characterise a single value toughness value. In this case, normally we define that crack growth will occur when
This corresponds to when the driving force curve is tangent with the R curve, as depicted in Fig.4.3(b). This can be interpreted as the critical condition when the energy available in the component for crack growth exceeds the maximum amount that the material can dissipate. This point of tangency depends on the shape of the driving force, which itself depends on the shape of the configuration of the structure. For example, the driving force curve for a through crack configuration is linear, but G in the double cantilever beam specimen varies with a2; these two configurations would have different Gc values for a given R curve.
Example 4.12 The following data were obtained from a series of tests conducted on pre-cracked specimens of thickness 10 mm,
| Crack length a (mm) |
Critical load P (kN) |
Critical displacement u (mm) |
|---|---|---|
| 30 | 4 | 0.4 |
| 40 | 3.5 | 0.5 |
| 50.5 | 3.12 | 0.63 |
| 61.6 | 2.8 | 0.78 |
| 71.7 | 2.67 | 0.94 |
| 79 | 2.56 | 1.09 |
where P and u are the critical load and displacement at each crack growth. The load displacement record for all crack lengths is linear up to a critical point. Determine the critical value of the strain energy release rate Gc = R from (a) the load displacement records and (b) the compliance-crack length curve.
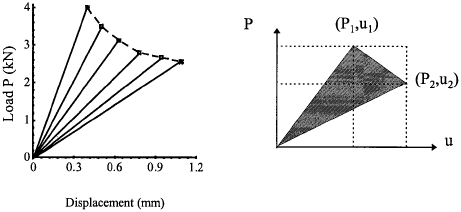
Solution The load-deflection curve can be constructed from the tabulated data, as shown in Fig.4.4(a). The area for a triangle depicted in Fig.4.4(b) is,
and so the energy released during each crack growth can be calculated
$$ G = R = { \text{Area} \over 2 \Delta a \cdot B} = { {1 \over 2} (P_i u_j - P_j u_i) \over 2 B (a_j - a_i)} $$The results for the five crack increments are: 30.0, 30.7, 30.2, 29.1, 30.8. (The unit is kJ/m2). Clearly this material exhibits little R-curve behaviour.
Looking for Fracture Calculators?
Here are a few to choose from:
4.4 Mixed Mode Loading: Fracture and Crack Path
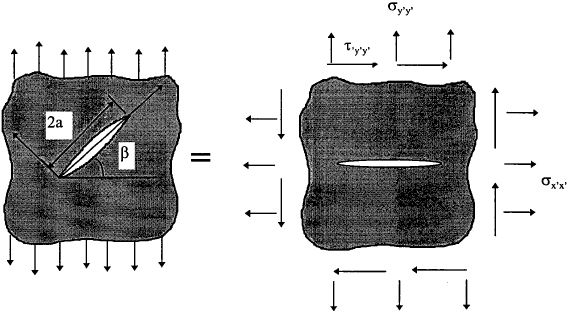
Most structures and components are subjected to more than one loading. When two or more modes of loading are present, equation (2.20) indicates that energy release rate contributions from each mode are additive. This equation assumes self-similar crack growth, however. If we consider an angled crack problem as depicted in Fig.4.5, coplanar growth means that the crack would grow at an angle 90° − β degrees from the applied stress. In practice, the crack tends to propagate in a direction orthogonal to the applied normal stress; i.e. the mixed-mode crack becomes a mode I crack. This is because a propagating crack seeks the path of least resistance (or the path of maximum driving force, or the path that the maximum amount of energy can be released) and need not be confined to its initial plane. A number of criteria have been proposed to account for such effects. Among them, the most widely used are (i) crack growth will take place in the direction of maximum energy release rate; (ii) crack growth occurs in a direction perpendicular to the maximum principal stress; (iii) crack growth occurs where the strain energy density is the minimum. It can be shown that criteria (i) and (ii) are identical and the differences between these criteria are generally small.
If a crack is loaded in combined mode I and II, the stresses σθ and τrθ at the crack tip can be derived from the expressions in Table.2.2, by adding the stresses due to the separate mode I and mode II. The result is as follows:
Suppose that the crack in question forms an infinitesimal kink at an angle α from the plane of crack, as shown in Fig.4.6. The local stress intensity factors at the tip of this kink differ from the nominal K values of the main crack. If we define a local x'-y' coordinate system at the tip of the kink, we can define the local mode I and mode II stress intensity factors,
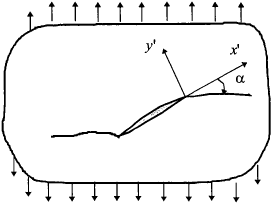
The energy release rate for the kinked crack is
According to the energy release rate criterion, crack propagation would occur in a direction along which the above energy release rate attains a maximum value. This is shown in Fig. 4.7, where the energy release rate G(α) is normalised by G(α = 0).
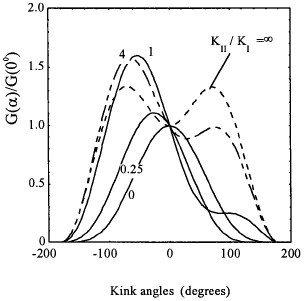
Since
the maximum of the strain energy release rate dG(α)/dα = 0 is equivalent to KII(α) = 0 or dKI/dα = 0, thus the peak in G(α) at each α0 corresponds to the point where KI(α) exhibits a maximum and KII(α0) = 0. In other words, the energy release rate criterion is identical to maximum hoop stress criterion. Figs.4.8 show the hoop stress distributions for three mixed mode ratios: KII/KI = 0 (mode I), KII/KI = 1, KII/KI = ∞ (mode II).
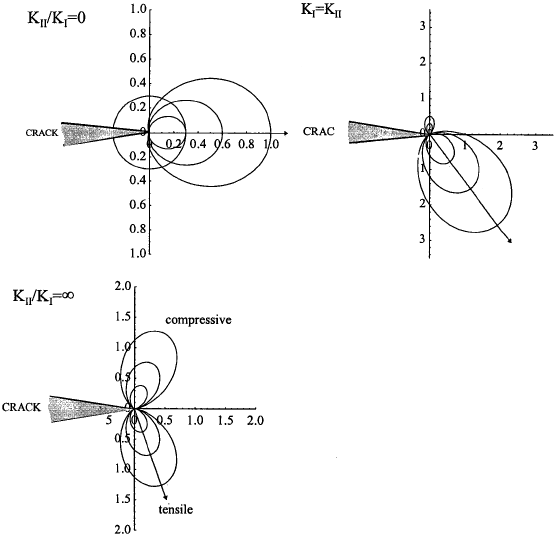
The arrows in the figures mark the direction of crack propagation, which is given by the following equation
so
which yields,
The critical value of KI or KII at which crack propagation occurs can be determined from the following equation,
Example 4.13 Determine the propagation angle for an inclined crack subjected to uniaxial tension.
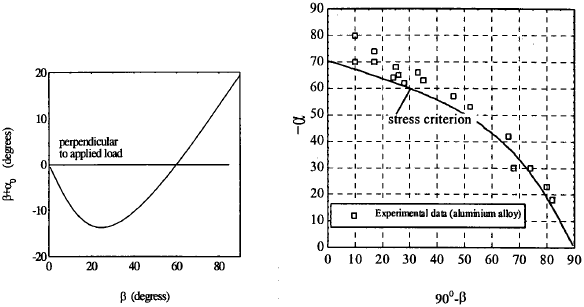
Solution: Assume the crack is inclined at an angle β to the applied load, as depicted in Fig.4.5. The mode I and mode II stress intensity factors can be determined as,
$$ K_I = \sigma \sqrt{\pi a} \cos^2 \beta ~~~~\text{and}~~~~ K_{II} = \sigma \sqrt{\pi a} \cos \beta \sin \beta $$consequently the mode I to mode II ratio is equal to (1/tanβ), hence the kink angle is equal to β + α0,
$$ \beta + \alpha_0 = \beta + 2 \tan^{-1} \left( {1 \over 4 \tan \beta} - \sqrt{ \left({1 \over 4 \tan \beta}\right)^2 + {1 \over 2} } \right) $$which is depicted in Fig.4.9, together with some experimental data.
