Fatigue Crack Growth and Life Prediction
This page provides the chapter on fatigue crack growth and life prediction from Wang, C. H. "Introduction to Fracture Mechanics," DSTO Aeronautical and Maritime Research Laboratory, DSTO-GD-0103, 1996.
Other related chapters from "Introduction to Fracture Mechanics" can be seen to the right.
5. Fatigue and Life Prediction
5.1 Fatigue Crack Growth Equations
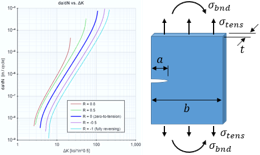
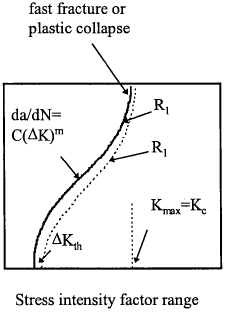
When a constant range of cyclic stress, Δσ (= σmax - σmin), is applied to a cracked structure, stable fatigue crack growth can occur at stress levels well below the yield stress of the material. In fact, the range of the stress intensity factor ΔK, where ΔK = Kmax − Kmin in a cycle may also be well below the materials fracture toughness KIC. The reason for this is simple: the material near the crack tip is under severe plastic deformation (see Chapter 3). Since the stress-strain field near a crack tip is uniquely determined by the stress intensity factor, fatigue crack growth rates can be correlated to ΔK and Fig.5.1 shows a typical plot which can be divided into three zones; threshold, stable crack growth and instability.
In general the crack propagation rate of a given crack subjected to a constant amplitude loading depends primarily on the range of stresses in the fatigue cycle (σmax , σmin), and on the crack length. It is also influenced by the stress ratio R = σmin/σmax. In simple cases where the condition of similitude holds, the stress intensity factor concept allows account to be taken of the two major terms by means of the stress intensity factor range,
The concept of similitude is important for fatigue crack growth, as it provides the basis for applying fracture mechanics to fatigue crack growth. Similitude implies that the crack tip conditions are uniquely defined by a single loading parameter such as the stress intensity factor.
Now let us consider a growing crack under the action of a constant amplitude cyclic stress intensity. A cyclic plastic zone forms at the tip of the crack, and the growing crack leaves behind a plastic wake. If the plastic zone is sufficiently small that it is entirely embedded within an elastic singularity zone (see Examples 2.7 and 3.1), the conditions at the crack tip are uniquely defined by the current K, and the crack growth rate is characterised by Kmin and Kmax. If the crack is long and/or the stress is high, then crack instability and rapid acceleration can occur since Kmax is close to the fracture toughness of the material KIC. At lower value of ΔK the linear portion of the curve in Fig.5.1 may be expressed as
where C and m are material, environment, stress state (stress ratio R) and temperature dependent. This equation is sometimes referred to as the Paris law. Equation (5.2), especially in its integral form, is widely used to evaluate the lifetime of cracked structures from a knowledge of the material. Usually the value of m for many engineering materials is between 2 and 4. Finally at very low ΔK values, a threshold is reached, ΔKth, below which long cracks do not grow.
Experimental fatigue crack growth data are usually obtained from tests on simple specimens and are normally presented in terms of fatigue crack propagation rates (da/dN), ΔK and variations in values of R. In cases where σmin is compressive the crack may close during the fatigue cycle and no clear convention for calculating ΔK has peen established. Nevertheless, two popular approaches are:
- the full range of the stress cycle will have been used, when calculating ΔK
- only the tensile part of the cycle will have been considered, that is ΔK = Kmax.
To describe the crack growth rate over the complete range of variation, including threshold and fracture instability, a number of empirical relationships have been proposed. One example is the Pridle equation,
The mechanisms responsible for the threshold phenomenon are rather complicated. The most popular explanation is crack closure: due to the compressive stress induced by the plastic wake, the "true" stress intensity factor at the tip of the crack is "shielded" so that no plastic deformation can occur, hence no crack growth. Another possible explanation is that the crack tip plastic deformation cannot penetrate the microstructural barriers, such as grain boundaries, etc.
When a structural component is subjected to fatigue loading, a dominant crack reaches a critical size under the peak load during the last cycle leading to a catastrophic failure. As an example, consider a plate with a crack of 2a0 subjected to a uniform stress σ perpendicular to the plane of the crack. The total number of cycles for the crack to reach 2af can be obtained by integrating the fatigue crack propagation law given by equation (5.2),
Using equation (2.31) we obtain
Assuming that the function Y(a) is equal to its initial value Y(a0) so that
thereafter
The critical crack length af at which unstable crack growth occurs can be determined from fracture toughness (see Chapter 4). Usually, however, the geometry factor Y(a) varies with the crack length a and the integration of equation (5.5) cannot be performed directly, but only through the use of numerical methods.
Example 5.14 A large centre-cracked plate containing an initial crack of length 2a0 = 10 mm is subjected to a constant amplitude cyclic tensile stress ranging between a minimum value of 100 MPa and a maximum of 200 MPa. Assuming the fatigue crack growth rate is governed by the equation
$$ {da \over dN} = 0.42 \times 10^{-11} (\Delta K)^3 ~\text{(m/cycle)} $$- Calculate the crack growth rate when the crack length has the following values 2a0 = 10 mm, 30 mm, 50 mm.
- Assuming further that the relevant fracture toughness is 60 MPa√m, estimate the number of cycles to failure.
Solution
(1) Determine the critical crack size, ac,
$$ a_c = {1 \over \pi} \left({K_{IC} \over \sigma_{max}}\right)^2 = 28.7 \times 10^{-3} ~\text{(m)} $$This means the total crack length at fast fracture is 57.3 mm.
(2) Crack growth rates:
| 2a = 10 mm | \(\Delta K = \Delta \sigma \sqrt{\pi a}\) = 12.53 MPa√m |
| \( da \over dN \) = 0.42×10-11 × (12.53)3 = 8.26×10⁻⁹ (m/cycle) | |
| 2a = 30 mm | \(\Delta K = \Delta \sigma \sqrt{\pi a}\) = 21.7 MPa√m |
| \( da \over dN \) = 0.42×10-11 × (21.7)3 = 4.29×10⁻⁸ (m/cycle) | |
| 2a = 50 mm | \(\Delta K = \Delta \sigma \sqrt{\pi a}\) = 28 MPa√m |
| \( da \over dN \) = 0.42×10-11 × (28)3 = 9.24×10⁻⁸ (m/cycle) | |
(3) Fatigue life:
Looking for Fracture Calculators?
Here are a few to choose from:
5.2 Effect of Stress Ratio and Crack Closure
Let us now consider the crack tip plastic deformation in more detail, as it is the driving force for crack growth. For a crack under cyclic loading, the plastic size is related to the stress intensity factor at the maximum load,
where α is defined in Chapter 3 and σys refers the material's uniaxial yield stress. When the applied load is reversed, the local stress at the tip of the crack is also reversed, inducing reversed yielding. At the minimum load, the size of the reversed plastic zone is, according to superposition principle,
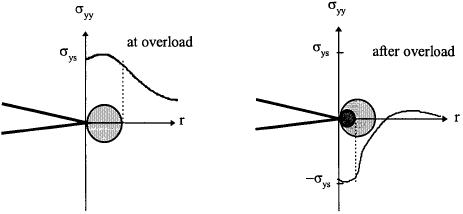
It is clear that for a asymmetrical loading (R ≠ -1), ΔK ≠ 2Kmax, the maximum (sometimes called monotonic or forward) plastic zone is not equal to the reversed plastic zone, which is normally smaller than the forward plastic zone. The main reason for this smaller plastic zone is due to the residual stress induced by the maximum load. A graphical representation is shown in Fig. 5.2.
When the crack growth rates observed under different applied stress ratio R are compared, it is noted that fatigue crack growth rate exhibits a dependence on the R ratio, particularly at both extremes of the crack growth curve. While the R ratio effect on the upper end of the curve can be explained in terms of the interaction between fatigue and ultimate failure at or near Kc, the explanation for the effect near threshold is slightly more complicated.
It was first reported by Elber (1971) that the elastic compliance of several fatigue specimens showed a bi-linear relationship, as depicted in Fig. 5.3. At high loads, the compliance of the fatigue specimen agreed with standard formulas for cracked specimens derived from fracture mechanics assuming monotonic loading. But at low loads, the compliance was close to that of an uncracked specimen. It was believed that this change in compliance was due to the contact between crack surfaces (crack closure) at loads that were greater than zero. This surprising finding that fatigue cracks close at above zero load led to the postulation that the crack closure decreased the effectiveness of the applied stress intensity factor range. Crack faces (near crack tip) are in contact below Kop, hence the stress intensity factor range over which the crack is open is equal to Kmax − Kop, which is defined as the "effective stress intensity factor range", denoted as ΔKeff. The main factor contributing to crack closure is the plasticity wake induced behind the crack tip. As the crack grows, plastically deformed material remains in the region through which the crack has propagated. When the component is unloaded, the large mass of elastically loaded material compresses the small plastic region and causes regions of the crack surface to come into contact with one another before zero nominal stress is reached.
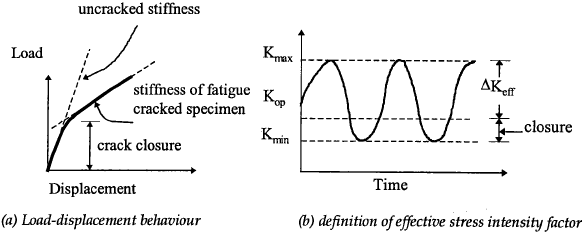
This concept of crack closure may be used to explain the effect of mean stress on crack propagation rates and leads to the definition of an effective stress intensity factor range ΔKeff . At higher values of R, less crack closure tends to occur and ΔKeff approaches ΔK because Kop approaches Kmin. Now the fatigue crack growth equations (5.2) should be modified accordingly by replacing ΔK with ΔKeff.
The ratio between the effective and applied stress intensity factors is normally denoted as U,
For instance, the effective stress ratio U for 2023-T3 aluminium at various stress ratios was reported to be independent of load levels and can be expressed as
Although some researchers have argued and experimentally demonstrated that U also depends on Kmax, it seems that there is a great deal of confusion and controversy about the Kmax dependence of U. Nevertheless, the concept of crack closure has been widely acknowledged and demonstrated to be useful in interpreting fatigue crack growth under variable amplitude loading.
Looking for Fracture Calculators?
Here are a few to choose from:
5.3 Variable Amplitude Loading
As discussed earlier, fatigue life prediction for constant amplitude loading is reasonably straightforward, provided the fatigue crack growth constants are known. However, the majority of engineering structures are subjected to fluctuating loading, and the life prediction is generally much more complicated than that outlined in the previous section. The factors that affect crack growth include variable amplitude spectrum, crack retardation due to overload, and acceleration due to underload. A number of theories and engineering methods have been proposed to reflect these effects.
Strictly speaking, for a fracture mechanics approach to be valid for fatigue crack growth under spectrum loading, the similitude condition has to be satisfied. For a crack growing in a rising or falling K field, similitude may be approximately satisfied if dK/da is small. In the case of overload, due to change in crack tip plastic deformation, similitude does not strictly hold. Simple fatigue crack growth laws that assume similitude are usually conservative when applied to variable amplitude loading. For example, a loading history can be cycle counted to identify reversals, using the rainflow or range pair method, then a linear summation of the fatigue lives of the various constant amplitude loads in the loading history would provide a first order approximation. However, such a method generally leads to conservative predictions (shorter lifetime), as it ignores the crack retardation effect to be described below.
It was first recognised empirically in the early 1960s that the application of a tensile overload in a constant amplitude cyclic load leads to temporary slower crack growth rate following the overload. Such a phenomenon is called crack retardation. In other words, the crack growth rate becomes smaller than it would have been under constant amplitude loading of the same magnitude. It was also recognised that a tensile-compressive overload following a constant amplitude cyclic load has little crack retardation effect. In fact, a compressive overload alone would accelerate crack growth. The effect of crack retardation can be better appreciated if we consider the elastic-plastic deformation ahead of a growing crack. Upon the application of a tensile overload, a large plastic zone is induced at the crack tip. After the removal of the overload, the elastic material surrounding the plastic zone acts like a clamp on this zone causing compressive residual stresses. As the crack propagates into the plastic zone, the residual compressive stresses tend to close the crack, leading to a decreasing growth rate as the crack advances into the compressive residual stress field. The effect of retardation will gradually diminish as the crack grows out of this residual stress field. It is easy to envisage that the opposite will occur for an compressive overload: the residual stress will be tensile, leading to faster crack growth.
The development in fatigue crack growth prediction can be roughly divided into three stages chronologically.
- The first generation of crack growth analysis was based on linear assumption of constant amplitude data for da/dN versus ΔK, viz the Palmgren-Miner linear rule, which results directly from the integration of crack growth law (see next section). As the effect of loading sequence is totally ignored in this approach, the accuracy of the resulting prediction is generally poor.
- From experimental results, a number of interactions between different load cycles of different magnitude have been observed, most notably retardation after overload and crack growth acceleration after underload. Based on these experimental findings, several plastic yield zone models, so called second generation, were proposed. The most widely used is the Wheeler model, which needs to be experimentally calibrated for a given spectrum. The main disadvantage of this type of the model is the sensitivity to loading spectrum thus rendering it impossible to be used for "blind" predictions.
-
The third generation crack growth models, commonly called strip yield model, emerged after the discovery of crack closure by Elber (1971). When plotted against the effective stress intensity factor, which is the difference between the maximum stress intensity factor and the stress intensity factor below which crack remains closed, the effects of loading sequence and stress ratio would virtually disappear. Based on this simple fact, several models have been developed to calculate the effective stress intensity factor. For example Newman (1992; 1995). The crack opening stress level is analytically calculated using the Dugdale-Barenblatt strip yield model. After the crack has advanced a distance, a plastic wake is left behind, which in general exerts a resistance to crack closing during the downward half cycle, thus reducing the effective stress intensity which dictates crack growth rate. This plastic wake can also be (partially) destroyed if a high underload is applied, resulting in a temporary acceleration of crack growth. The essence of this method is to analytically determine the stress level required to counter act the resistance exerted by the residual plastic deformation (or the stress level above which the crack remains open), and the crack growth rate is given by the effective stress intensity factor,
$$ {da \over dN} = C \Delta K_{eff}^m = C (K_{max} - K_{op})^m = C \left[ 1 - S_o/S_{max} \over 1 - R \right]^m \Delta K^m $$where constants C and m are empirically determined from experiments. Parameter S is the applied stress, and R is the stress ratio (Smin/Smax). Clearly the only unknown in the above equation is the crack opening stress level So. This approach has been successfully used to correlate and predict large-crack growth rate behaviour under a wide variety of loading conditions. This is possible because the crack tip plastic deformation process that drives the crack is uniquely determined by the stress intensity factor. However, when the crack is small, the plastic strain distribution ahead the crack tip is no longer solely controlled by the stress intensity induced by the crack, but also depends on the macro-stress/strain state, which is geometry and loading dependent.
The first two methods are relatively easy to apply, while the strip yield models were more numerically involved, although this type of analysis was reported to give better correlations to fatigue crack growth under spectrum loading. In the following, some detailed discussion of these methods is presented.
5.3.1 First Generation Model and Palmgren-Miner Linear Rule
It is easy to demonstrate the Palmgren-Miner linear damage summation rule is a direct result of crack growth rate being proportional to crack length (m = 2 in the Paris law). Let an initial stress range Δσ1 be changed to a different stress range Δσ2 when the crack has grown from a0 to a1 after N1 cycles. At the second stress range the crack grows to af to cause failure after N2 cycles.
At the first stress range, from equation (5.7),
hence
For the second stress range level
$$ N_{f2} = {1 \over C (\Delta \sigma_2)^2 \pi} \ln {a_f \over a_0} $$hence
hence
Similarly one can prove that the same conclusion can be obtained for a more general crack growth relationship,
This is left as an exercise for the reader. Therefore the Palmgren-Miner linear summation rule assumes inexplicitly that (1) the crack growth rate is proportional to crack length and (2) the proportionality is solely dependent on the instantaneous stress level and independent of loading history. As will be seen later that assumption (2) is generally not true, owing to the crack closure effect, which is history dependent.
5.3.2 Wheeler Model
If there had been no overload, the crack would have progressed with a plastic zone of size equal to
where α = 1 for plane stress and α = √3 for finite thickness, and Kmax is the amplitude of applied stress intensity factor. At the moment of the overload the plastic zone size is

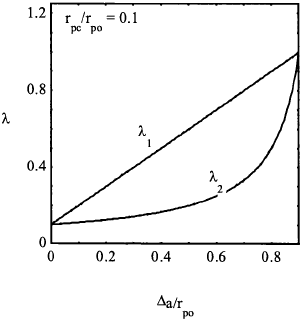
Wheeler assumed that retardation effect persists as long as rpc is contained within rpo, see Fig.5.4, but the overload effects disappear when the current plastic zone touches the outer boundary of rpo. At any instant, the distance between the crack tip and the outer boundary of rpo is equal to Δa + rpc, we can define two parameters
which are plotted in Fig.5.5. A retardation factor can now be defined as
where γ is a fitting parameter. The crack growth rate is reduced from the baseline value by ϕ:
An important point about the Wheeler model is that the exponent γ depends on material properties and loading spectrum. Therefore this parameter must be obtained empirically from an experiment with a stress spectrum that has similar characteristics of that to be analysed. A variable amplitude loading analysis must be performed to determine the γ value that gives the best correlation of crack growth. The model can then be applied to structural predictions for components subjected to the same spectrum but of different magnitude. A re-calibration of the Wheeler model with new experiments must be carried out if the structure is subjected to a different stress spectrum. The linear summation method can be considered as a special case of Wheeler's model by setting γ = 0 .
Looking for Fracture Calculators?
Here are a few to choose from:
5.4 Damage Tolerance Design Methodology
The term damage tolerance has a variety of meanings, but normally refers to a design methodology in which fracture mechanics analysis is used to predict crack growth life and quantify inspection intervals. This approach is usually applied to structures that are susceptible to time-dependent flaw growth. The two objectives of damage tolerance analysis are to determine (1) the effect of cracks on the (residual) strength and (2) crack growth behaviour as a function of time. Damage tolerance analysis consists of several steps. A brief outline of the steps involved in damage tolerance calculations is given below. Assuming the service loading spectrum and material properties (fracture toughness and fatigue crack growth rate constants) are known:
- Determine the size of initial defects, e.g. NDI inspection.
- Calculate the critical crack size at which failure would occur (see Chapter 4)
- Integrate fatigue propagation equations to determine the number of load cycles (or blocks) for the crack to grow from its initial size to its critical size (see section 5.1)
- Set inspection interval to half the life calculated in step 3.
A comparison between "safe-life" and "damage tolerance" design methodologies is given below.
| Safe-life | Damage tolerance |
|---|---|
| structure is assumed to be defect free | initial defect is assumed to exist: equal to NDI limit |
| no crack formation at design service life | inspection to detect crack |
| design life < service life with or without repair | crack is assumed to grow to critical length in two inspection intervals |
| life at 1.2 design loads equal to 1.5 design life | |
| safe life derived from S-N curves (local strain approach) | crack growth determined from fracture mechanics |
| scatter factor of 3-4 applied to calculated lives | scatter factor = 2 in fatigue crack growth |
| failure probability = 0.001 | failure probability after 2 inspections = 0.001 |
